Silly distribution rates
It’s been a year, but I’m looking at covered call ETFs again and the silly “distribution rates” some are advertising.
Behind the scenes, covered call ETF sponsors smell a gold rush and are delivering “income” products of all shapes and sizes to investors of all shapes and sizes.
These investors are yield-hungry and volatility-averse and have plowed more than $100 billion into covered call strategies over the past several years with enthusiasm.
Perhaps too much enthusiasm.
Despite the “negative mechanical relationship” (Devil’s Bargain, 2024), investors can’t seem to get enough.
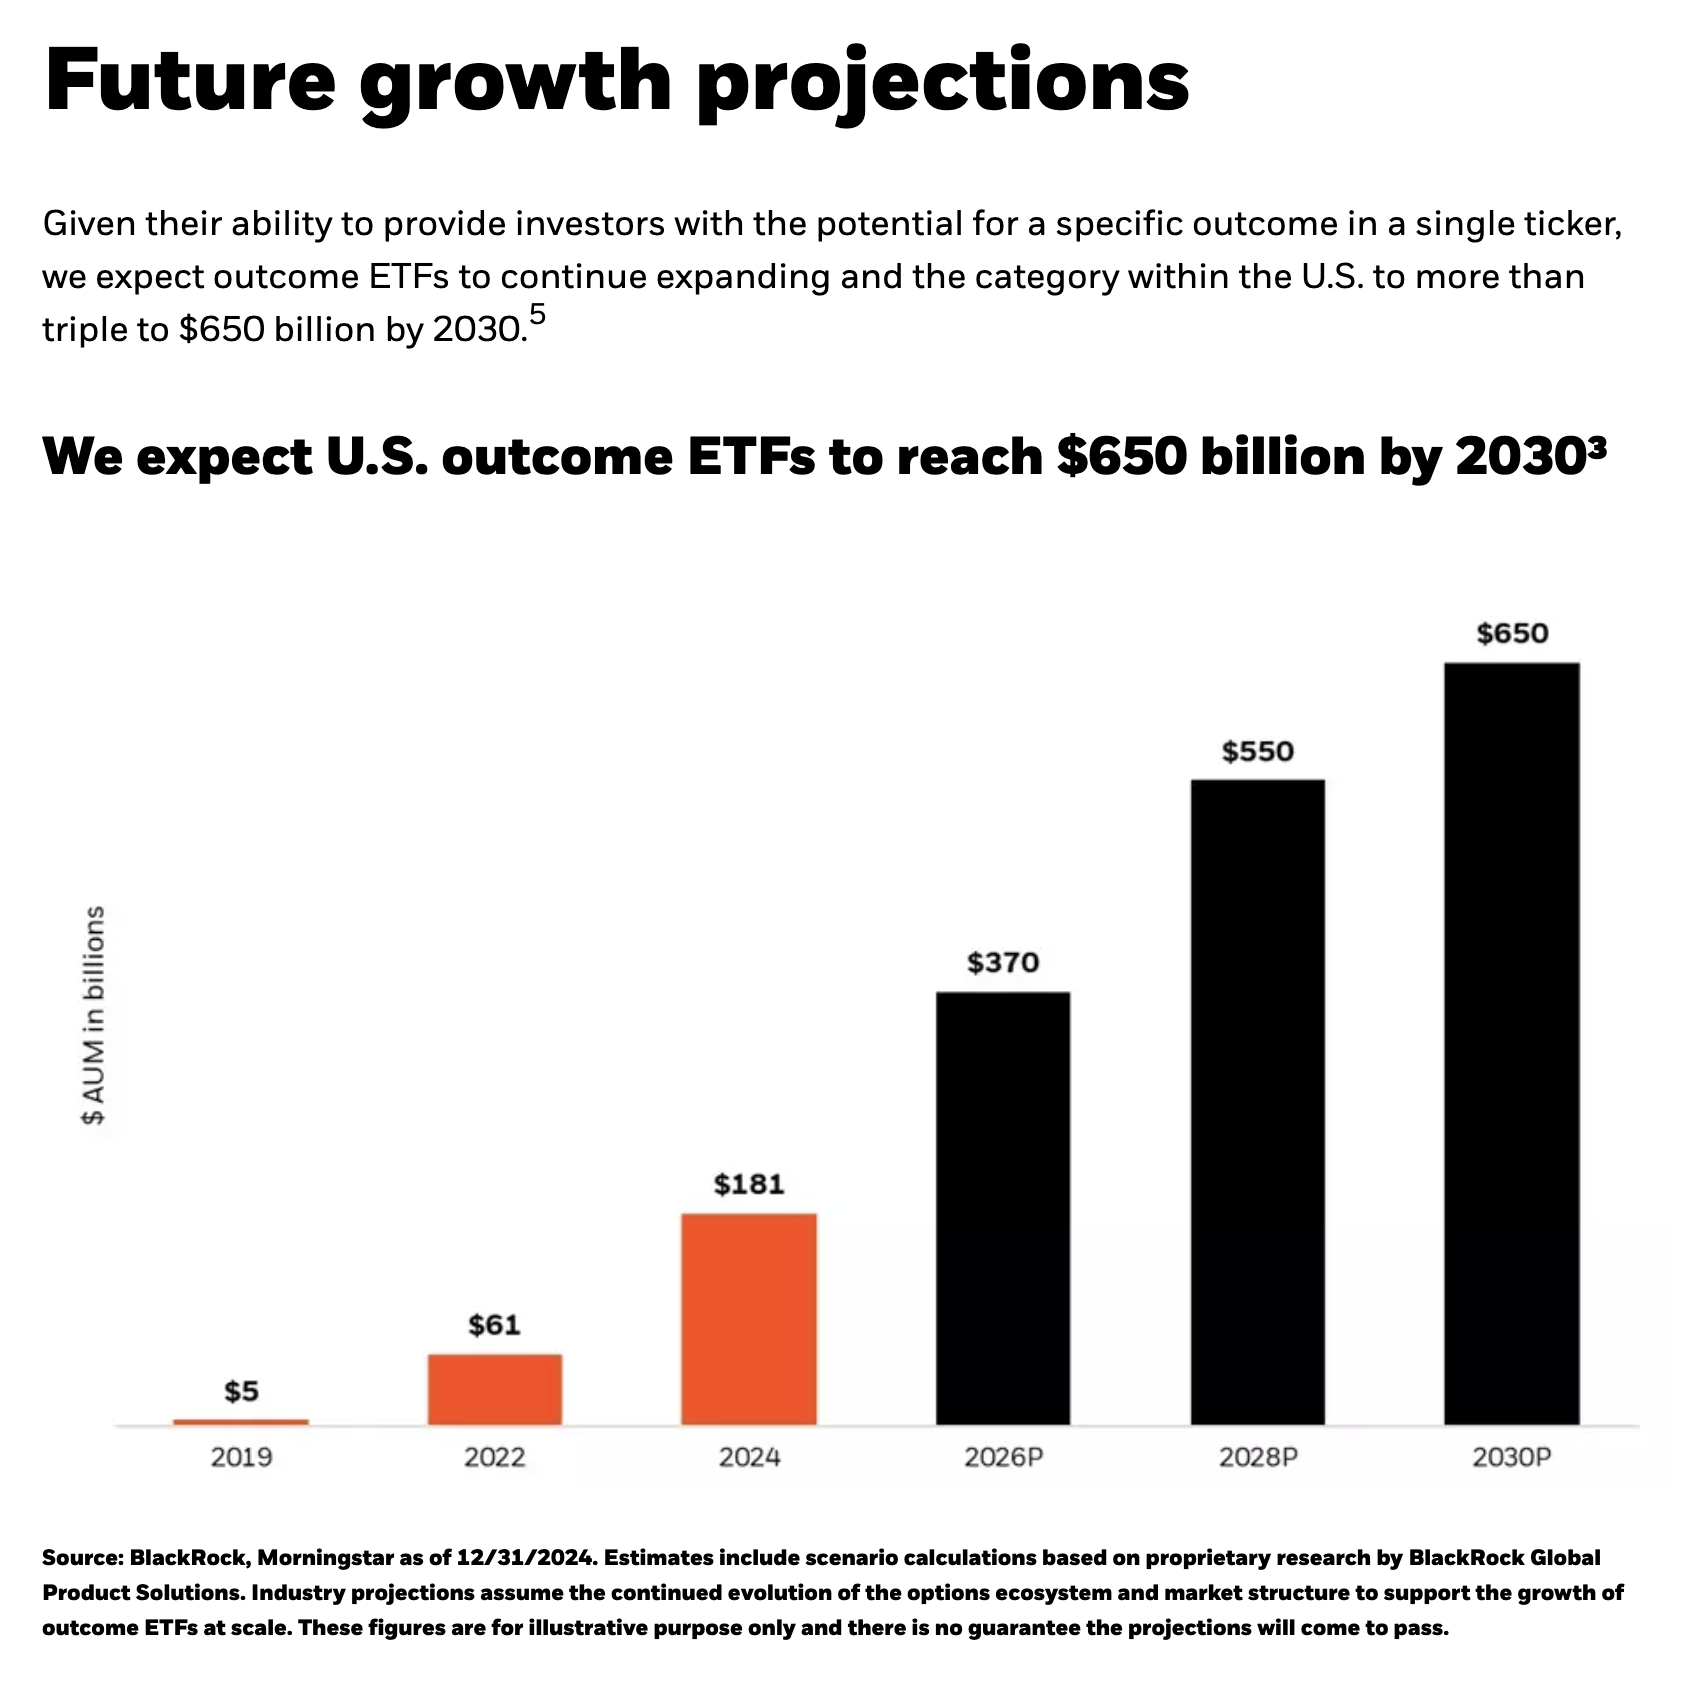
BlackRock predicted in early 2025 that the broader category of outcome ETFs1 will grow to $650 billion (>3x its current size) by 2030.
When everything is a covered call, it’s hard to know what’s quality and what’s not.
Risk-adjusted returns are an excellent starting point.
But, most covered call ETFs are only a few years old, and haven’t survived a market cycle, so, to complement total return, we need to look at:
- How it’s built
- What it distributes
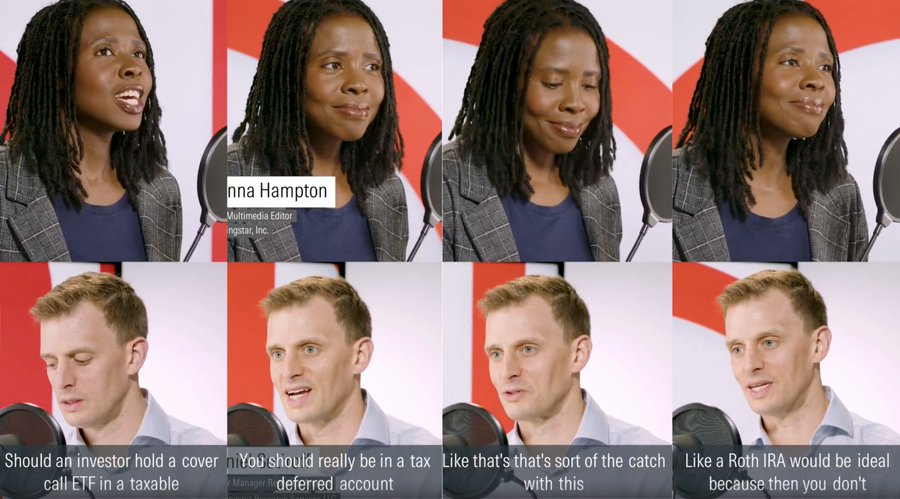
My QQFF framework for assessing covered call ETF distributions explains after-tax total return, even though Morningstar doesn’t think it’s such a good idea to hold them in taxable accounts.
Investors have tons of ETFs to choose from, and the sponsors know how to get their attention.
That’s not nefarious on its own… unless the metrics they report are misleading.
Eye-Watering Yield