What's behind the preposterous tax efficiency of buffer ETFs?
An old trick applied in a new way
Whether you believe in buffer ETFs or not, they are undeniably tax-efficient
An ETF’s tax cost is relatively easy to measure: Look at the quantity and quality of its distributions1.
If an ETF distributes a lot of ordinary income regularly, that’s mostly tax-inefficient2.
If an ETF distributes capital gains occasionally, that’s relatively more tax-efficient than ordinary distributions3.
If an ETF never distributes, that’s about as tax-efficient as it gets4.
Morningstar's Tax Cost Ratio does a good (but not perfect) job of quantifying this.
Most buffer and structured protection ETFs distribute nothing due to “the tax-efficiencies inherent to the ETF structure,” a banality I’ll unpack shortly.
This means investors choose when they pay taxes by selling the ETF.
If held for over a year, they will pay federal long-term capital gains plus other taxes, like NIIT and state/local tax, depending on their circumstances, but nothing between purchase and sale.
This piece explains how this works.
I use FT Vest as an avatar for buffer ETFs since it is large, transparent about distribution quantity and quality, and essentially throws a (tax) perfect game, which we'll get into next.
This is analysis, not advice or an endorsement of any product. I have no idea if these products make sense for you or your clients. But if you want to know how they work, keep reading.
Distribution data
Many ETF sponsors publish an ICI Primary Layout - the spreadsheet they provide to brokers, so brokers can prepare 1099-DIVs, which investors use to file their tax returns - on their websites (or will send via email if you ask nicely) annually.
This file contains an ETF’s distribution date, quantity, and tax character and usually arrives in January.
What do the data reveal?
Pure buffer ETFs usually distribute nothing
The biggest single buffer ETF is BUFR with ~$6.6 billion AUM (May 16, 2025)5.
It is actually an ETF-of-ETFs, holding other FT Vest buffer ETFs, including the conveniently named FMAY ($868 million AUM), FJUN ($950 million AUM), etc.
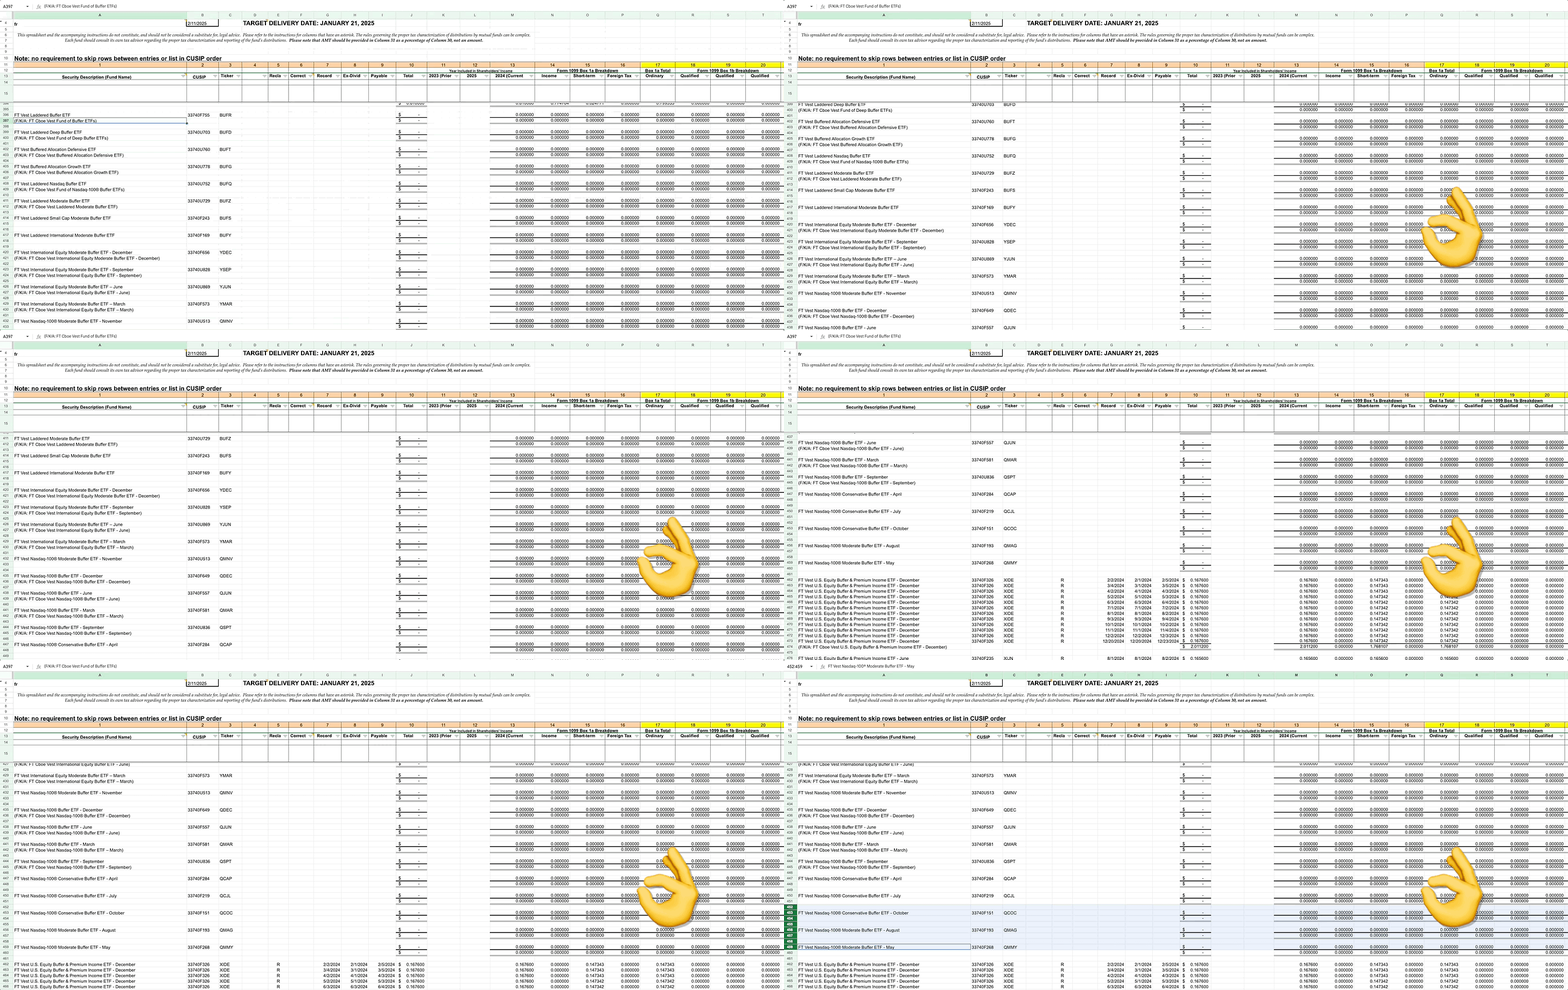
In any case, if we look at FT Vest’s 2024 ICI Primary Layout (available here), we see a wall of zeroes.

2024 wasn’t unusual.
We see the same thing if we open FT Vest’s 2023 and 2022 ICI Primary Layouts. Nada. Zero. Zilch distributions6.
This means, in effect, that pure buffer strategies are about as tax-efficient as it gets7.
This is by design.


